Weather-Guide.com
Queenstown Weather
The following weather chart displays the monthly average weather conditions for Queenstown, New Zealand. The red line displays the monthly day time maximum temperature while the blue line shows the average night time minimum. The bar chart indicates the number of wet days per month that Queenstown experiences.
Queenstown, New Zealand Weather Chart
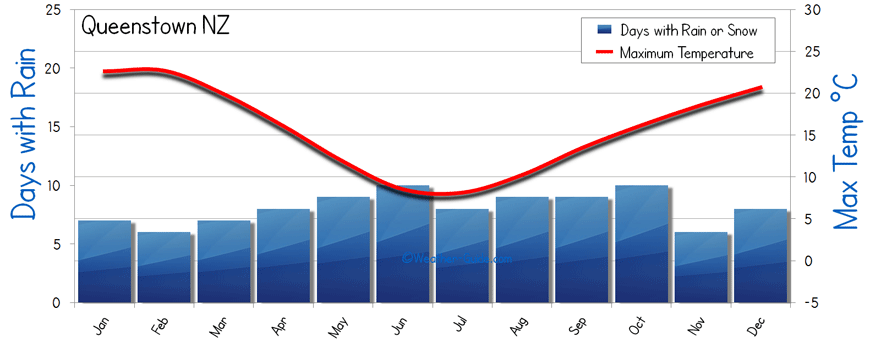
The average weather for Queenstown, New Zealand
Queenstown, NZ Temperature
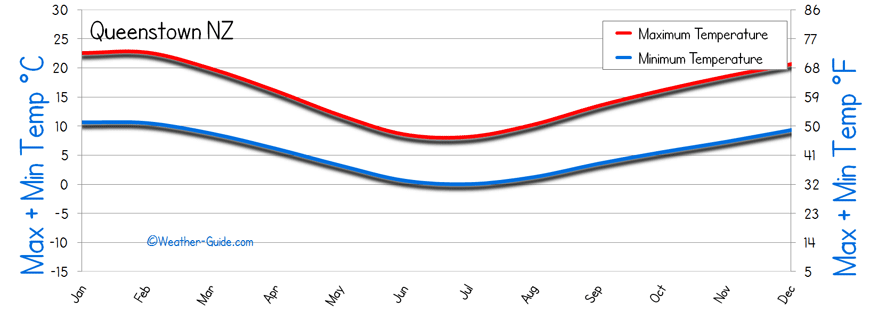
Queenstown, New Zealand Temperature in Centigrade and Fahrenheit Temperature Chart
The above temperature chart of Shanghai displays the maximum day time and minimum night time temperatures in both centigrade and fahrenheit.
Queenstown Rainfall and Amount of Rain
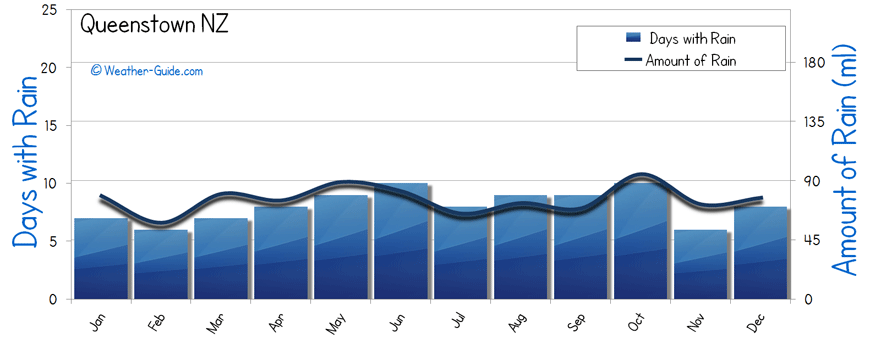
Average Rainfall for Shanghai
The blue bar chart displays the average number of wet days that Shanghai experiences per month. This is plotted against the average amount of rainfall per month.
Queenstown Sunshine and Sun Hours
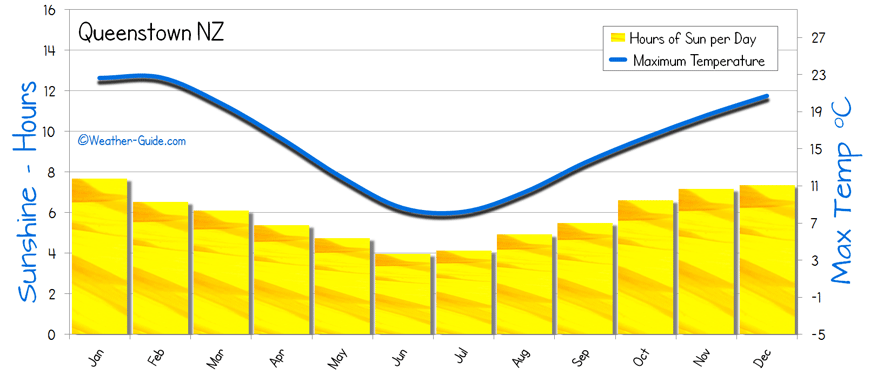
Shanghai Sunshine hours per month and maximum temperature
The above chart displays the number of hours of sunshine per day as a monthly average for Shanghai. This is plotted against the maximum day time temperature.
More New Zealand Weather
World Weather
Auckland - Christchurch - Dunedin - Hamilton - Hokitika - Kaitaia
Napier - Nelson - New Plymouth - Palmerston North - Queenstown - Rotorua - Wellington
Australia & NZ - Asia - Canada - China - East Europe - France
Germany & Italy - India - Iberian Peninsula - Korea - Mexico - North Africa - Japan
South America - Sri Lanka - Thailand - USA - Uk & Ireland
Vietnam
Weather-Guide.com, With Over 1,000 Pages There's Too Many To List Here!