Weather-Guide.com
Cancun Weather
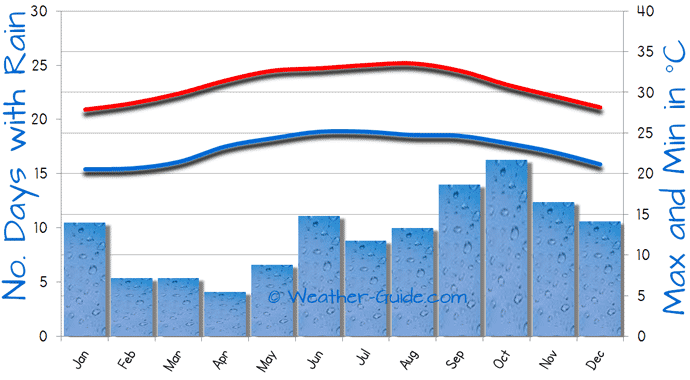
The weather chart below shows the average weather conditions per month for Cancun, Mexico. The red line displays the monthly day time maximum temperature while the blue line shows the average night time minimum. The bar chart indicates the number of wet days per month that Cancun experiences.
Cancun Weather Chart
The average weather for Cancun, Mexico
More Mexican Weather
World Weather
Acapulco - Aguascalientes - Cancun - Chihuahua - Ciudad Juarez - Cozumel
Culiacan - Guadalajara - Hermosillo - Huatulco - Veracruz - Zihuatanejo
Mexico City - Mexico City vs Chicago - Mexico City vs Los Angeles - Mexico City vs New York - Mexico City vs London
Australia & NZ - Asia - Canada - China - East Europe - France
Germany & Italy - India - Iberian Peninsula - Korea - North Africa - Japan
South America - Sri Lanka - Thailand - USA - Uk & Ireland
Vietnam
Weather-Guide.com, With Over 1,000 Pages There's Too Many To List Here!
City Comparison Weather Charts
Or Weather Destinations Home Page
Weather Definitions
The number of wet days is defined as any day when more than 0.1mm of rain falls (this is a very small amount). The wet day can range from just a single shower through to a complete day of rain but the number of wet days per month is a very useful guide when planning a holiday to Cancun in Mexico. For a travel guide to Mexico City click here.
The Cancun weather chart and data has been averaged into monthly segments to aid in choosing a suitable season to visit Cancun. The average monthly maximum temperature is the average air temperature that is in a place of shade therefore Cancun temperatures in direct sunlight during the summer months will be much higher.