Weather-Guide.com
Lombok Weather Averages
The following weather chart displays the monthly average weather conditions for Lombok in Indonesia. The first chart summarizes the average weather for Lombok. The second weather chart details the maximum and minimum temperature of Lombok in both centigrade and fahrenheit. The third weather chart displays the average amount of rain plotted against the total number of wet days per month.
Lombok Weather Chart
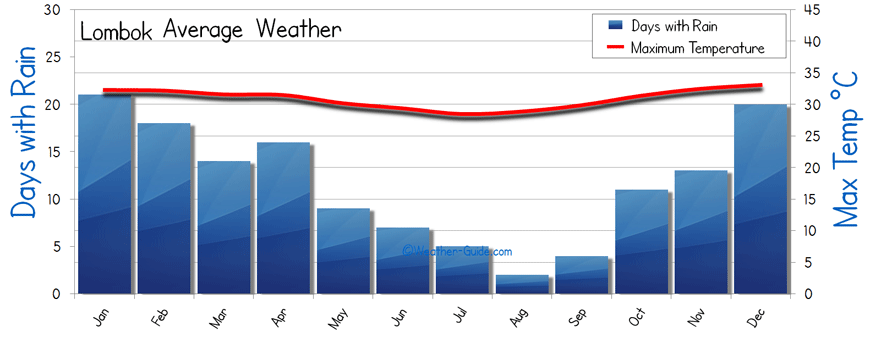
The average weather for Lombok
Lombok Maximum and Minimum Temperature
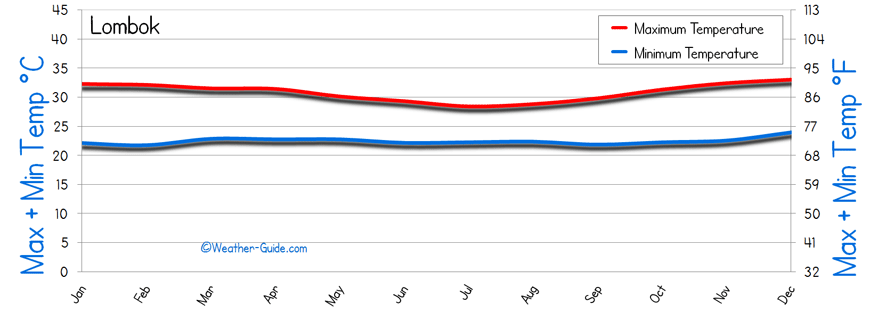
Lombok Temperature in Centigrade and Fahrenheit
The above temperature chart of Lombok displays the maximum day time and minimum night time temperatures in both centigrade and fahrenheit. The average monthly maximum temperature is the average air temperature that is in a place of shade therefore Lombok temperatures in direct sunlight during the summer months will be much higher. The average temperature does not alter significantly during the year, it is hot and humid all year round just perfect beach weather.
Lombok Rainfall and Wet Days
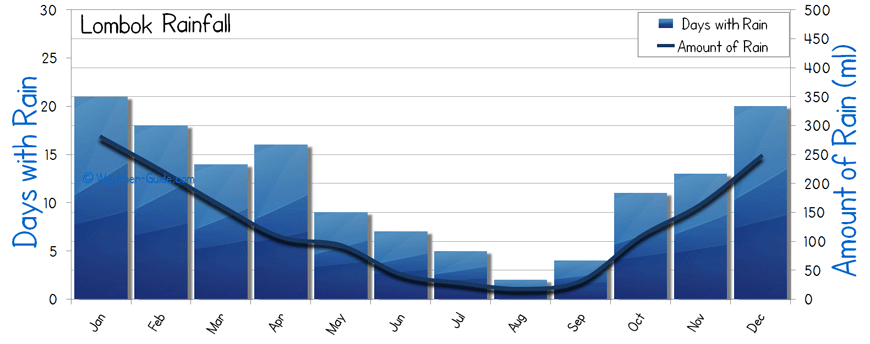
Average Rainfall for Lombok
The blue bar chart displays the average number of wet days that Lombok experiences per month. This is plotted against the average amount of rainfall per month. The long wet winter season is best avoided.
More Indonesia Weather
World Weather
Bali - Denpasar - Gili Islands - Lombok - Mataram - Seminyak - Senggigi - Tanjung Benoa
Australia & NZ - Cambodia - Canada - China - East Europe - France
Germany & Italy - India - Iberian Peninsula - Korea - Mexico - North Africa - Japan
South America - Sri Lanka - Thailand - USA - Uk & Ireland - Vietnam & Laos
Weather-Guide.com, With Over 1,000 Pages There's Too Many To List Here!